How to Create a Thinkorswim Scan


TG
3 min read
Creating a Stock Scan in Thinkorswim
Hello Traders! We’ll be going over how to create a ThinkorSwim scan, which will allow you to automatically scan for stocks that fit the criteria you define in the scan.
The first step will be navigating to the “Scan” tab at the top left-hand side of the screen.
Next, you can navigate your way to the far right of the screen, and hover on what looks like three lines stacked on top of one another.
It is right next to the flame symbol, which is the sizzle index.
After hovering over the three stacked lines, you can choose between public and personal scans, and then navigate over to the scan that you wish to populate.
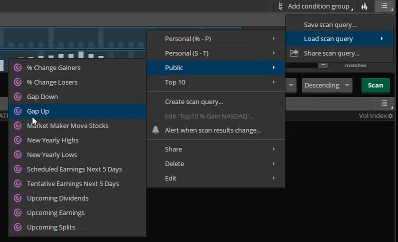
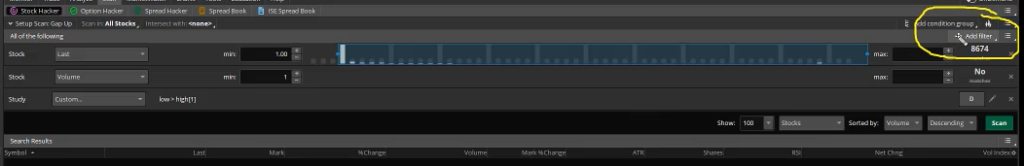
Whatever scan you click on, it will populate its specific criteria on the scan dashboard for you.
Depending on the scan criteria, it will offer different parameters for you to be able to adjust to further customize your scan.
If you have populated a scan and want to add additional filters, navigate over to the right-hand corner of the screen and click the “+Add Filter” button.
A nifty feature of the ThinkorSwim scans is that as you populate each different scan criteria, it will automatically show you how many matches you’re getting for that individual criteria.
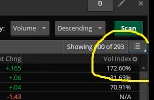
Whatever scan results you get from your pre-selected criteria, there is even more filtering that can be done by adjusting the different information columns.
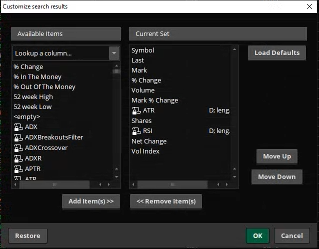
At the far right of the screen in the banner that is showing the different column criteria, there is a small gear icon to click on. Click on “Customize” in the little pop-up menu.
This will populate a “Customize search results” window that offers you the ability to add, take off, and adjust the overall way the column criteria is displayed.
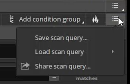
Once you have developed a scan that you like and you want to save it, navigate back over to the right-hand side of the screen and click on the 3 stacked lines next to the flame symbol.
Click on “Save scan query” and save it under a name that makes sense to you!
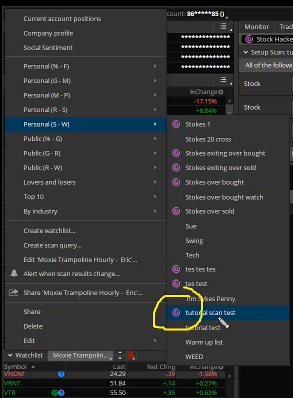
An efficient way to go about running through your scan criteria is to populate it in a watchlist tab on the left side of your screen.
You hover over the box to the right of the “Watchlist” row on the left side of your screen.
Scroll up to personal, find the scan that you saved, and give it a click!
The purple symbol to the right of the scan name is showing that it is not just a regular watchlist, but scan results that you’re populating in the watchlist column.
If you link your charts to your watchlist, you are then able to click through the scan results rapidly, having it populate across your workspace for easy analysis.
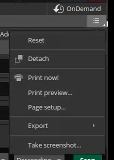
If you would like to detach your scanner for ease of use, you can navigate your way to the three stacked lines again at the top right-hand corner of the screen.
This time we’ll be clicking on the stacked lines that are right underneath “OnDemand” and above the stacked lines that are in the same row as the flame symbol.
On the drop-down menu, click “Detach.”
That concludes the breakdown of how to go about building a scan on ThinkorSwim! If you’d like free code for Thinkorswim to scan for TTM Squeeze setups, check out this article here!