
The Ultimate Guide to Options Basics
- August 5, 2023
- 6:23 pm
Learn everything about options trading 101 in this comprehensive guide with detailed explinations and illustrations.


“An investment in knowledge pays the best interest.” – Benjamin Franklin.
Welcome to Options Trading 101! If you’ve ever been curious about the world of options trading but felt overwhelmed by complex terminology and strategies, you’ve come to the right place. In this comprehensive blog, we’ll break down the basic terms and concepts associated with options trading. Whether you’re a complete beginner or just looking to brush up on the fundamentals, this guide is designed to make options trading accessible and understandable for everyone.
Table of Contents:
II. Options Premium
III. Options Expiration
IV. Options Greeks
VII. Advanced Option Strategies
VIII. Options Trading Resources
Options Basics
A Comprehensive Overview
Options trading opens doors to a world of financial possibilities, but getting started requires learning a new language of terms and concepts. In this section, we’ll break down the essentials, exploring what stock options are, the meaning of call and put options, what a strike price is, how an options chain works, and the key differences between options and stocks.
What Are Stock Options
Stock options are financial contracts that give the holder the right, but not the obligation, to buy or sell an underlying stock at a predetermined price (strike price) before a specified expiration date. These contracts come in two primary forms: call options and put options. Options trading is popular because it allows traders to profit from price movements in stocks without owning the underlying asset.

What Is A Call Option
A call option is a financial contract that grants the holder the right to buy an underlying stock at a specified strike price before the option’s expiration date. Call options increase in value as the underlying stock’s price rises, making them an attractive choice for bullish investors who believe a stock’s price will appreciate over time.


What Is A Put Option
A put option, on the other hand, is a financial contract that gives the holder the right to sell an underlying stock at a specified strike price before the option’s expiration date. Put options increase in value as the price of the underlying stock declines, making them an appealing choice for bearish investors who anticipate a stock’s price will depreciate over time.

The Difference Between Calls and Puts
The primary difference between call and put options lies in the holder’s rights. Call options allow the holder to buy an underlying stock at a predetermined price, while put options grant the holder the right to sell an underlying stock at a predetermined price. Investors use call options when they believe the stock price will increase and put options when they think the stock price will decrease.
What Is A Strike Price
The strike price is the predetermined price at which the holder of an option can buy (call option) or sell (put option) the underlying stock. It serves as the reference point for the option’s value and plays a crucial role in determining whether an option is in-the-money, at-the-money, or out-of-the-money.


What is The Options Chain
The options chain is a table that shows the available call and put options for a particular stock, including important details such as their respective strike prices, expiration dates, and premiums. It serves as a valuable tool for investors and traders, offering a comprehensive view of the options market for a given stock. This information helps them analyze various potential trades, making it easier to compare prices and evaluate possibilities. The options chain is typically where most options traders will select a trade setup and execute it, as it provides all the necessary information in one place. By utilizing the options chain, traders can make informed decisions that align with their investment strategies and risk tolerance, ensuring they choose the options that are best suited to their needs.
Trading Options vs Stocks
Trading options and stocks differ in several ways:
- Leverage: Options trading offers leverage, allowing investors to control a larger number of shares with a smaller initial investment compared to buying stocks outright.
- Risk: Options trading can involve lower risk compared to owning stocks, as the maximum loss for purchasing an option is limited to the premium paid. However, selling options can expose the investor to potentially unlimited losses.
- Flexibility: Options provide more strategic possibilities compared to trading stocks, including the ability to profit from various market conditions and hedge existing positions.
- Expiration: Options have an expiration date, while stocks do not. As a result, options traders need to be aware of time decay, which erodes the value of an option as it approaches expiration.
What Is Buying Power
Buying power refers to the amount of capital available in an traders’s trading account to purchase securities, such as stocks or options. In the context of options trading, buying power may be affected by margin requirements, which vary depending on the type of option strategy being utilized. Understanding buying power is essential for options traders, as it determines their ability to enter and exit positions and manage risk effectively.
Section 2: Options Premium
Unveiling the Hidden Value of Options: In the Money, Out of the Money, and Beyond
Options premiums are the key to understanding the true value of options. In this section, we’ll explore in-the-money and out-of-the-money options, intrinsic value, and extrinsic value. You’ll learn how these concepts interconnect to determine the overall value of an option, allowing you to make informed trading decisions.
What is Options Premium
Options premium is the price paid by the buyer to the seller for the rights granted by an option contract. It consists of two components: intrinsic value and extrinsic value (also known as time value). The options premium is influenced by factors such as the underlying stock’s price, the option’s strike price, the time remaining until expiration, and the stock’s implied volatility.
In the Money Options
An option is considered “in the money” (ITM) when it has intrinsic value. For call options, this occurs when the underlying stock’s price is higher than the option’s strike price. For put options, it happens when the stock’s price is lower than the strike price. In-the-money options are more likely to be exercised, as the holder can buy or sell the underlying stock at a more favorable price than the current market price.
Out Of The Money Options
An option is considered “out of the money” (OTM) when it has no intrinsic value, meaning the option’s strike price is unfavorable compared to the current market price of the underlying stock. For call options, this occurs when the stock’s price is lower than the strike price. For put options, it happens when the stock’s price is higher than the strike price. Out-of-the-money options are less likely to be exercised, as the holder would be buying or selling the underlying stock at a less favorable price than the current market price.
The Importance of Intrinsic Value
Intrinsic value represents the real, tangible value of an option. It is the difference between the underlying stock’s market price and the option’s strike price (for in-the-money options). Intrinsic value is a crucial component of an option’s premium, as it reflects the potential profit if the option were exercised immediately. An option with a higher intrinsic value is generally more expensive, as the buyer is paying for the right to buy or sell the underlying stock at a more advantageous price.

Time Value and Its Impact on Premiums
Time value, also known as extrinsic value, is the other component of an option’s premium. It represents the amount a trader is willing to pay for the possibility that the option will become profitable before its expiration. Time value is influenced by factors such as the time remaining until expiration and the implied volatility of the underlying stock. As an option’s expiration date approaches, its time value decreases due to the diminishing probability of the option becoming profitable. This phenomenon is known as time decay. We will discuss theta decay in detail in a later section.

How Volatility Affects Premiums
Volatility plays a significant role in determining an option’s premium. Implied volatility is a measure of the market’s expectation of the underlying stock’s price movement over the life of the option. Higher implied volatility suggests that the market anticipates larger price swings, increasing the probability that the option will become in-the-money. As a result, options with higher implied volatility typically command higher premiums, as the buyer is paying for the increased potential to profit from these price movements.
Section 3: Options Expiration
Time is Money: Mastering the Art of Options Expiration
The clock is always ticking in the world of options trading. In this section, we’ll delve into the importance of options expiration and its impact on trading decisions. Understanding options expiration will help you manage risk, maximize profits, and make informed choices in your trading journey.
Understanding Options Expiration Date
Options expiration date is the last day an option contract can be exercised or traded. After this date, the option becomes worthless, and the holder loses the rights granted by the contract. The expiration date is crucial in options trading, as it determines the time frame for the option to become profitable. Options with a longer time until expiration are generally more expensive, as they offer the buyer more time for the underlying stock’s price to move favorably.
Options Expiration: The Final Countdown
As the expiration date of an option approaches, its premium typically decreases due to time decay. This decline in premium can impact both the buyer and the seller. Buyers need to be aware that the value of their options may erode over time (theta decay), making it more challenging to realize a profit. On the other hand, sellers can potentially benefit from time decay, as the options they sold may lose value, allowing them to buy them back at a lower price or let them expire worthless, this is also known as selling premium and is often done in the form of a credit spread.
Options Assignment: The Risk of Early Exercise
Options assignment occurs when the holder of an in-the-money option chooses to exercise their rights, requiring the option seller to fulfill their obligations. For call options, this means the seller must deliver the underlying stock at the strike price. For put options, the seller must buy the underlying stock at the strike price. Option sellers must be prepared for the possibility of early assignment, as it can lead to unexpected losses or margin requirements.
Triple Witching and Quad Witching: Market Mayhem
Triple witching and quad witching refer to the simultaneous expiration of options contracts, leading to increased trading volume and market volatility. Triple witching occurs on the third Friday of March, June, September, and December when stock options, stock index futures, and stock index options expire simultaneously. Quad witching adds single stock futures to the mix and occurs on the same dates as triple witching. Traders need to be aware of these events, as they can cause significant price swings and impact trading decisions.

Understanding the Greeks in Options Trading
Options trading is an intriguing and complex field that has attracted many investors and traders over the years. One aspect that is particularly vital to understanding how options work is the Greeks. These mathematical concepts, named after letters in the Greek alphabet, help traders gauge how different factors such as price, time, and volatility might affect the price of an option. Let’s take a closer look at these Greeks and demystify them for those new to options trading.
What is Delta?
In options trading, Delta is also known as the “participation rate.” Delta is a measure that represents the sensitivity of an option’s price to a $1 change in the underlying asset’s price. Essentially, if the Delta of an option is 0.5, then the option’s price will increase or decrease by 50 cents for every $1 change in the price of the underlying asset.
What is Gamma?
Gamma is a measure in options trading that describes the rate of change of an option’s Delta in response to a $1 change in the price of the underlying asset. Think of it as a car’s accelerator pedal. Delta is like the speed of the car, showing how fast the option’s price changes as the underlying asset’s price changes. Gamma, then, tells you how quickly that speed is either picking up (accelerating) or slowing down (decelerating).
If Gamma is high, it means that the option’s price is highly sensitive to changes in the underlying asset’s price, much like a car that accelerates quickly when you press down on the gas pedal. If Gamma is low, the option’s price changes more slowly in response to changes in the asset’s price, like a car that takes more time to gain speed.
For a trader, high Gamma might offer opportunities to profit quickly from market changes, but it also comes with increased risk if the market doesn’t move as expected.
What is Theta?
Theta is often referred to as time decay in the world of options. Think of an ice cube melting on a hot day. Just as the ice cube gets smaller over time, an option loses value as it gets closer to its expiration date. If Theta is -0.05, the option’s price will shrink by 5 cents every day until it expires. Knowing about Theta helps traders choose the right options with the most advantageous time frames, making sure they don’t end up with a completely melted ice cube (worthless option).
What is Vega?
Vega is a measure used in options trading to describe how the price of an option changes in response to a 1% change in the implied volatility of the underlying asset. It’s not an actual Greek letter like Delta or Gamma but is still often included in the “Greeks” that describe various risk factors in options pricing.
In simple terms, Vega tells you how sensitive an option’s price is to fluctuations in the volatility of the underlying asset. If Vega is high, the option’s price will change significantly if the implied volatility of the underlying asset changes, while a low Vega means the option’s price is less sensitive to changes in implied volatility.
Understanding Vega is vital for options traders because it helps them gauge how changes in market volatility may affect the price of the options they are trading. It’s a critical component in risk management and can be particularly important during times of increased market uncertainty or volatility.
What is Rho?
Rho is another one of the “Greeks” in options trading, and it measures the sensitivity of an option’s price to changes in the interest rate. Specifically, Rho tells you how much the price of an option is expected to change for a 1% change in interest rates.
For example, if an option has a Rho of 0.05, the price of the option would increase by 0.05 (or 5 cents) if interest rates were to increase by 1%, and it would decrease by the same amount if interest rates were to decrease by 1%.
Rho is particularly important for long-term options, as short-term options are generally less sensitive to interest rate changes. Traders and investors use Rho to assess how changes in interest rates might impact the price of options, helping them to manage risk and make more informed decisions in various interest rate environments.
Section 5: Unlocking the Potential of Options: Proven Strategies for Success
What Is A Covered Call
A covered call is a conservative options strategy where an investor or trader sells call options against shares of stock they already own. The purpose of this strategy is to generate income through the premiums collected from selling the call options. If the stock price remains below the strike price of the sold call options, the investor (seller) keeps the premium and retains their shares. However, if the stock price rises above the strike price, the call option may be exercised, requiring the investor to sell their shares at the strike price.

What Is An Iron Condor
An iron condor is an advanced options strategy that involves simultaneously selling an out-of-the-money call and put option, while also buying a further out-of-the-money call and put option on the same underlying stock with the same expiration date. This strategy aims to profit from a stock that remains within a specific price range over a certain period. The iron condor generates income through the premiums collected from selling the options, and the risk is limited by purchasing the further out-of-the-money options.

What Is A Broken Wing Butterfly
A broken-wing butterfly is a variation of the standard butterfly spread, where one of the wings is “broken” by adjusting the strike prices of the options. This strategy is constructed by buying one in-the-money option, selling two at-the-money options, and buying one out-of-the-money option. The broken-wing butterfly is designed to profit from a limited move in the underlying stock’s price, while reducing the risk of loss in case the stock moves significantly in one direction.

What Is A Butterfly Spread
A butterfly spread is a neutral options strategy that involves buying a call (or put) option with a lower strike price, selling two call (or put) options with a higher strike price, and buying another call (or put) option with an even higher strike price. All options have the same expiration date. The goal of this strategy is to profit from a stock that remains within a specific price range, as the maximum profit occurs when the stock price is at the middle strike price at expiration.

What Is A Credit Spread
A credit spread is an options strategy that involves selling an option and simultaneously buying another option with a lower premium on the same underlying stock and expiration date. The difference between the premiums received and paid results in a net credit, which is the maximum potential profit for the trader. Credit spreads are used to generate income in a range-bound market and can be constructed using either call or put options.

What Is A Debit Spread
A debit spread is an options strategy that involves buying an option with a higher premium and simultaneously selling another option with a lower premium on the same underlying stock and expiration date. The difference between the premiums paid and received results in a net debit, which is the maximum potential loss for the trader. Debit spreads are used to profit from directional moves in the stock price and can be constructed using either call or put options.

What Is an Options Strangle
An options strangle is a strategy that involves buying an out-of-the-money call option and an out-of-the-money put option on the same underlying stock with the same expiration date. The goal of this strategy is to profit from a significant move in the stock price, either up or down. The maximum profit is unlimited, while the maximum loss is limited to the premiums paid for the call and put options.

Options Strategies Every Trader Should Know
In addition to the strategies mentioned above, traders should be familiar with vertical spreads, calendar spreads, ratio spreads, and condors. Each options strategy has its own risk-reward profile and is suited for different market conditions and trading objectives. By understanding and mastering various options strategies, traders can increase their chances of success in the options market and tailor their approach to fit their individual trading goals and risk tolerance.
Trade Exit Strategies
Exiting an options trade can be as important as entering it, as it determines whether a trader realizes a profit or loss. Some common exit strategies for options trading include:
- Profit target: Exiting a trade when a predetermined profit level is reached. This strategy helps traders lock in profits and avoid giving them back if the market reverses.
- Stop-loss: Exiting a trade when a predetermined loss level is reached. This strategy helps traders limit their losses and manage risk effectively.
- Time-based exit: Exiting a trade based on a specific time frame or as the expiration date approaches. This strategy can help traders avoid the risks associated with holding options until expiration, such as time decay or assignment risk.
- Technical exit: Exiting a trade based on technical analysis indicators, such as moving averages or trendlines. This strategy helps traders exit positions when the market signals a potential change in direction.
- Rolling: Adjusting an options position by closing the current trade and opening a new one with a different strike price or expiration date. This strategy can help traders manage risk or extend the potential for profit in an existing position.
By understanding and implementing the appropriate exit strategy for each options trade, traders can better manage risk, protect profits, and adapt to changing market conditions.
Section 6: Best Option Indicators
Choosing the Right Tools: Top Indicators for Options Trading Success
Navigating the options trading landscape requires a strong understanding of the best indicators to guide your decisions. In this section, we’ll discuss some of the most reliable and effective indicators that can help improve your options trading strategy, whether you’re a day trader, swing trader, or looking for long-term trends.
The Squeeze
The Squeeze is an indicator that measures market volatility by comparing the Bollinger Bands and Keltner Channels. When the Bollinger Bands move within the Keltner Channels, a “squeeze” occurs, indicating low volatility and the potential for a significant price movement in the near future. Traders can use this indicator to identify periods of consolidation and anticipate potential breakouts or price trends.
Trading with the RSI Indicator
The Relative Strength Index (RSI) is a popular momentum indicator that measures the speed and change of price movements. RSI values range from 0 to 100, with readings above 70 indicating overbought conditions and readings below 30 indicating oversold conditions. Traders can use the RSI to identify potential entry and exit points for options trades based on overbought or oversold conditions and potential reversals.
Best Free Options Trading Indicators
In the world of trading, indicators are essential tools that provide insights into market trends and potential future price movements. They help to smooth out the noise and volatility of market prices, giving traders a clearer picture of where things might be headed. By understanding and utilizing indicators such as Moving Averages, Support and Resistance, Bollinger Bands, Trend Lines, Fibonacci Extensions, and Fibonacci Retracements, traders can make more informed decisions. These valuable tools assist in identifying buying and selling opportunities, trend direction, and significant price levels, thereby playing a crucial role in successful trading.
Moving Averages
Moving averages are a fundamental tool used by traders to identify trends over a specific period. By calculating the average price of an asset over a set number of days, weeks, or months, a moving average smoothens the price data and filters out random fluctuations. This creates a line that traders can compare with current prices to determine the prevailing trend. The two main types of moving averages are the Simple Moving Average (SMA) and the Exponential Moving Average (EMA), with the latter giving more weight to recent prices, thus reacting more quickly to price changes.

Support and Resistance
Support and Resistance levels are critical indicators that help traders identify the price levels at which an asset’s price tends to stop and reverse. Support levels are price points where buying interest is significantly strong and exceeds the selling pressure, preventing the price from falling further. Conversely, Resistance levels are where selling interest overcomes buying pressure, stopping the price from rising further. Identifying these levels helps traders make educated decisions on entry and exit points.

Bollinger Bands
Bollinger Bands are a volatility indicator that consists of three lines: the middle line is a simple moving average, and the upper and lower lines are standard deviations away from this average. When the bands are closer together, it indicates low volatility, and when they are further apart, it signifies high volatility. Traders often use Bollinger Bands to identify overbought or oversold conditions, providing opportunities to buy low or sell high.

Trend Lines
Trend lines are straight lines drawn on a price chart, connecting significant lows in an uptrend or significant highs in a downtrend. They act as a visual representation of support and resistance in a trending market. A break above a downtrend line or below an uptrend line can signal a potential reversal in trend. Trend lines are simple yet powerful tools in technical analysis that assist traders in visualizing the direction of the market and potential reversal points.

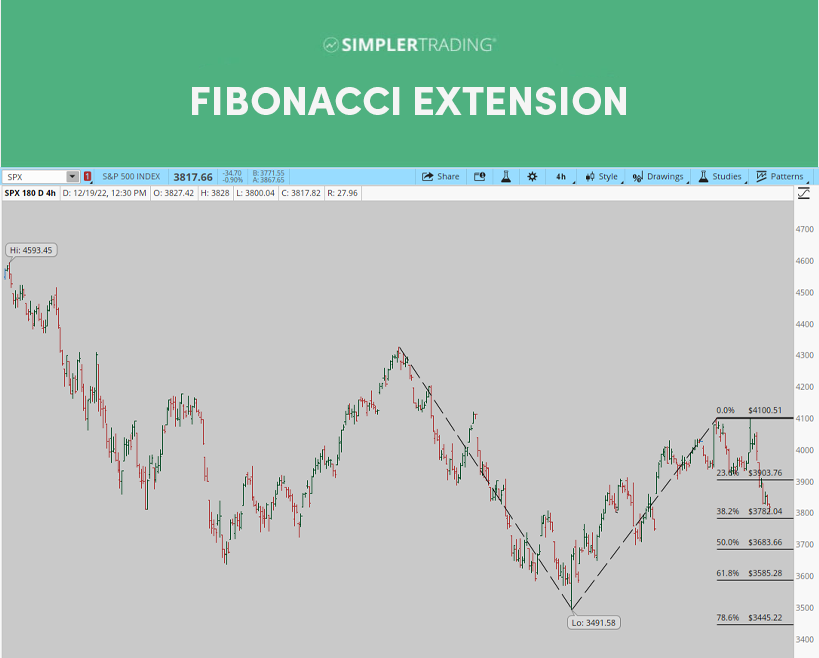
Fibonacci Extensions
Fibonacci Extensions are used to predict potential price targets in a trend continuation. By taking two extreme points on a chart, usually a major peak and trough, and dividing the vertical distance by key Fibonacci ratios (such as 61.8%, 100%, 161.8%), traders can identify where the price may find support or resistance in the future. These levels are often used to set take-profit orders or to identify areas where price momentum may slow or reverse.
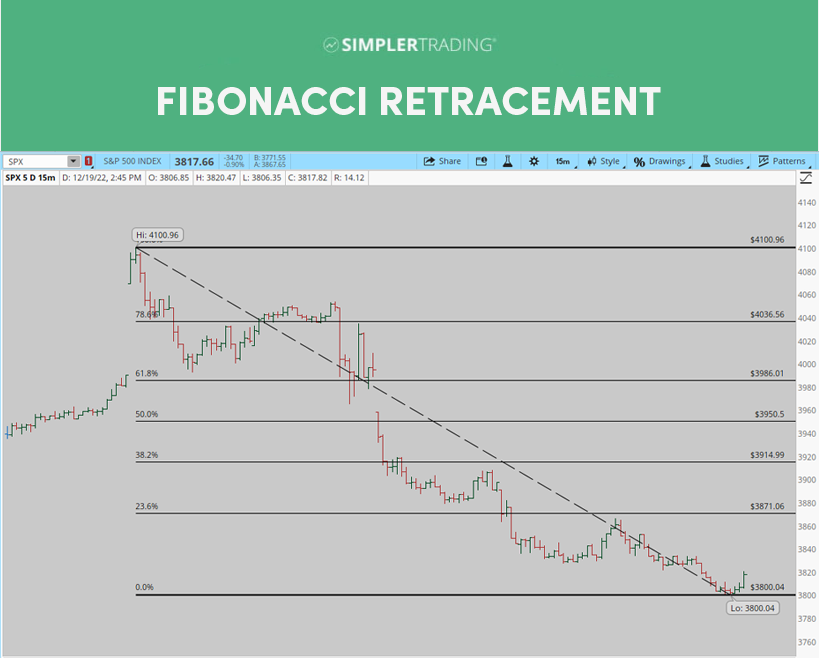
Fibonacci Retracements
Fibonacci Retracements are another powerful tool derived from the Fibonacci sequence. They help traders identify potential reversal levels in the market by using horizontal lines to indicate where support or resistance may occur. By taking the distance between a major high and low, and then applying the key Fibonacci ratios (such as 38.2%, 50%, 61.8%), traders can find levels where the price may bounce back in the direction of the prevailing trend. This can assist in entry and exit decision-making and risk management.
Trend Oscillator Indicator
The Trend Oscillator is a versatile indicator that measures the strength and direction of a trend. It can help traders identify potential trend reversals, continuation patterns, and entry or exit points for options trades. By incorporating the Trend Oscillator into your trading strategy, you can better assess market conditions and make more informed decisions in the options market.
Section 7: Advanced Option Strategies
Leveling Up: Mastering Advanced Techniques for Options Trading Success
As you become more experienced in options trading, it’s crucial to explore advanced strategies and techniques to further enhance your trading performance. In this section, we’ll dive into a variety of advanced concepts and tools that can help you sharpen your edge in the market and maximize your potential returns.
Understanding Put-Call Parity
Put-Call Parity is a fundamental principle in options pricing that highlights the relationship between the price of European call options and European put options with the same strike price and expiration date. Put-Call Parity ensures that arbitrage opportunities do not exist in the options market, and understanding this concept can help traders identify mispriced options and exploit potential opportunities.
What is Dark Pool Trading
Dark pools are private trading venues that allow institutional investors to trade large blocks of securities without revealing their orders publicly. Dark pool trading can impact options prices and liquidity, and understanding how these off-exchange transactions work can help traders navigate potential market inefficiencies.
Market Internals: Uncovering the Pulse of the Market
Market internals are a collection of metrics that provide insights into the overall health and direction of the market. By monitoring these indicators, traders can gain valuable information about market sentiment, momentum, and potential trend changes. Let’s delve into some of the most popular market internals and how they can be utilized in your trading strategy.
VIX: The Fear Index
The VIX, or CBOE Volatility Index, measures the expected volatility of the S&P 500 over the next 30 days. Often referred to as the “Fear Index,” the VIX can serve as a gauge of investor sentiment and a potential contrarian indicator. When the VIX is high, it suggests increased fear and uncertainty in the market, which may present buying opportunities for contrarian traders. Conversely, when the VIX is low, it indicates complacency, signaling a potential market top and an opportunity to sell or hedge.
Put-Call Ratio: Gauging Market Sentiment
The put-call ratio is a widely used indicator that measures the number of put options traded relative to the number of call options. A high put-call ratio indicates bearish sentiment, as more traders are betting on a decline in the market. In contrast, a low put-call ratio suggests bullish sentiment, with more traders expecting the market to rise. Like the VIX, the put-call ratio can be used as a contrarian indicator, with extreme readings potentially signaling market reversals.
Advance-Decline: Assessing Market Breadth
The advance-decline (A/D) line is a market breadth indicator that compares the number of stocks that are advancing (closing higher) to the number of stocks that are declining (closing lower). A rising A/D line indicates broad market strength, suggesting that a bullish trend is likely to continue. On the other hand, a falling A/D line reveals market weakness, which may signal a bearish trend or potential market reversal. Divergences between the A/D line and market indices can also provide valuable insights into the sustainability of a trend.
SKEW: Measuring Tail Risk
The CBOE SKEW Index measures the perceived tail risk in the S&P 500, or the likelihood of a significant market decline. A high SKEW value indicates that investors are anticipating a higher probability of a large market drop, while a low SKEW value suggests a lower perceived tail risk. Traders can use the SKEW Index to assess the market’s perception of risk and adjust their portfolios accordingly.
Traders can better understand the underlying forces driving the market by monitoring market internals such as the VIX, put-call ratio, advance-decline line, and SKEW Index. These indicators can help you make more informed trading decisions, manage risk, and ultimately improve your overall trading performance.
Other Advanced Options Trading Cocepts
How to Learn Tape Reading
Tape reading involves analyzing the time and sales data, order flow, and Level II quotes to identify potential trading opportunities and assess market sentiment. Learning to read the tape can help traders anticipate price movements, identify support and resistance levels, and improve their execution timing.
Option Hedging Techniques
Option hedging techniques involve using options to reduce the risk of an existing position or portfolio. Some common option hedging strategies include protective puts, covered calls, and collars. By employing these techniques, traders can manage their risk exposure and protect their investments from adverse market movements.
Slippage in Trading
Slippage occurs when the executed price of a trade differs from the expected price, usually due to market volatility or low liquidity. Traders can minimize slippage by using limit orders, adjusting their order sizes, and monitoring market conditions to improve their trade execution.
Understanding Market Signals
Market signals are cues or patterns in the market that can indicate potential trading opportunities, trend changes, or shifts in market sentiment. Traders can use various tools and techniques, such as technical analysis, fundamental analysis, and market internals, to identify and interpret these signals and make more informed trading decisions.
Using Volume in Stock Trading
Trading volume is the number of shares or contracts traded during a specific time frame, and
analyzing volume can provide valuable insights into market activity, liquidity, and trends. High trading volume often indicates strong interest in a security, while low volume may suggest a lack of interest or conviction. Traders can use volume to confirm price movements, identify breakouts, and spot potential reversals.
Trading Inverse ETFs
Inverse ETFs are exchange-traded funds designed to move in the opposite direction of their underlying index or benchmark. Trading inverse ETFs can be an effective strategy for profiting from market declines or hedging against downside risk in a portfolio. However, it’s essential to understand the risks and mechanics of inverse ETFs, such as their use of leverage and the effects of compounding on returns.
What is a Short Float
Short float refers to the percentage of a company’s shares that are currently sold short by investors, divided by the total number of shares outstanding. A high short float can indicate bearish sentiment towards a stock, while a low short float may suggest bullish sentiment. Monitoring the short float can help traders gauge market sentiment and potentially spot short squeeze opportunities, where a rapid increase in a stock’s price forces short sellers to cover their positions, further driving up the price.
With a solid understanding of these advanced options strategies and concepts, you’ll be well-equipped to navigate the ever-evolving world of options trading and find success in the market. Keep learning, stay disciplined, and adapt your approach as you gain experience, and you’ll be on your way to becoming a proficient options trader.
Section 8: Options Trading Resources
Empowering Your Options Trading Journey: Top Resources for Continued Success
A well-rounded trader’s education is never complete without delving into the wealth of knowledge provided by the best trading books. In this section, we’ll explore some of the most influential and insightful trading books that can help you develop your skills, enhance your understanding of the markets, and refine your trading strategy.
Essential Trading Books for Every Trader’s Library
1. Trading in the Zone by Mark Douglas
“Trading in the Zone” focuses on the psychological aspect of trading, addressing common mental pitfalls and the importance of discipline and emotional control. A must-read for traders looking to master their mindset.
2. The Disciplined Trader by Mark Douglas
Another masterpiece from Mark Douglas, “The Disciplined Trader” emphasizes the importance of developing a consistent trading approach, managing risk, and maintaining discipline in the face of market uncertainties.
3. Mastering the Trade by John F. Carter
“Mastering the Trade” is a comprehensive guide to various trading strategies and techniques, including technical analysis, risk management, and trade execution. Carter’s book is an invaluable resource for traders at all levels.
4. Technical Analysis and Stock Market Profits by Richard Schabacker
This classic book lays the foundation for modern technical analysis, covering essential charting techniques and patterns that are still relevant today. A timeless resource for anyone looking to hone their chart-reading skills.
5. The Wagon Wheel Income Generator by Bill Johnson
“The Wagon Wheel Income Generator” introduces a unique options trading strategy designed to generate consistent income with limited risk. Ideal for traders looking to add a new dimension to their options trading toolkit.
6. Fibonacci Trading by Carolyn Boroden
Carolyn Boroden’s “Fibonacci Trading” provides an in-depth look at the use of Fibonacci tools in trading, including retracements, extensions, and projections. A valuable guide for traders seeking to enhance their technical analysis skills.
7. Trading Options Greeks by Dan Passarelli
“Trading Options Greeks” offers a comprehensive introduction to the use of option Greeks in trading and risk management. Passarelli’s book is an essential read for those looking to deepen their understanding of options trading.
8. Technical Analysis Explained by Martin J. Pring
Martin J. Pring’s “Technical Analysis Explained” is a comprehensive guide to technical analysis, covering a wide range of techniques and tools. This book is perfect for traders looking to expand their technical analysis knowledge.
9. Market Wizards by Jack D. Schwager
“Market Wizards” is a collection of interviews with some of the most successful traders in history, providing valuable insights into their strategies, mindset, and approach to the markets. An inspiring read for traders at all levels.
10. The Intelligent Investor by Benjamin Graham
Widely regarded as the bible of value investing, “The Intelligent Investor” is a must-read for anyone looking to develop a long-term investment strategy based on fundamental analysis.
11. Reminiscences of a Stock Operator by Edwin Lefèvre
“Reminiscences of a Stock Operator” is a fictionalized account of the life and trading career of Jesse Livermore, one of the most famous traders in history. This classic book offers timeless trading psychology, risk management, and market dynamics lessons.
These books, carefully chosen for their depth and breadth of knowledge, can help traders of all levels refine their skills and strategies. By studying these essential trading books, you’ll be better equipped to navigate the ever-changing landscape of the financial markets.
Key Takeaways:
💡 Master the basics of options trading, such as knowing the difference between call and put options.
💡 Intrinsic value determines the real worth of an option, while time value accounts for its potential growth.
💡 Monitor options expiration closely to avoid unwanted assignments and manage risk effectively.
💡 Utilize strategies like covered calls and iron condors to diversify your options trading approach.
💡 Embrace technical analysis tools, like support and resistance, to predict market movements.
💡 Leverage indicators like the RSI and Squeeze to identify profitable trading opportunities.
💡 Explore advanced techniques, like put-call parity and market internals, to enhance your trading skills.
💡 Learn from the best by reading top trading books, such as “Trading in the Zone” and “Market Wizards.”
Conclusion
Now that you’ve unraveled the secrets of options trading, you’re equipped with the knowledge, strategies, and resources needed to succeed in this exciting financial realm. Remember, the key to success lies in continuous learning and improvement. So, stay informed, keep honing your skills, and embrace the world of options trading with confidence.
FAQs:
Q: What are stock options?
A: Stock options are financial contracts that give the option holder the right, but not the obligation, to buy or sell an underlying stock at a predetermined price (strike price) before a specified expiration date.
Q: What is the difference between a call option and a put option?
A: A call option gives the holder the right to buy an underlying stock at a specified strike price, while a put option gives the holder the right to sell an underlying stock at a specified strike price.
Q: What is options expiration?
A: Options expiration refers to the date when an option contract becomes invalid, and the holder can no longer exercise their right to buy or sell the underlying stock.
Q: What are some popular option trading strategies?
A: Some popular option trading strategies include covered calls, cash-secured puts, vertical spreads, iron condors, and straddles.
Q: What are some advanced options strategies?
A: Advanced option strategies include calendar spreads, diagonal spreads, butterfly spreads, iron butterflies, and ratio spreads.
Q: What are some reliable resources for learning more about options trading?
A: Some reliable options trading resources include books, online courses, websites, podcasts, and mentorship programs.
References:
McMillan, L. G. (2011). Options as a Strategic Investment. New York: Prentice Hall Press.
CBOE. (2021). Options Education. Retrieved from https://www.cboe.com/education/.
Investopedia. (2021). Options Basics. Retrieved from https://www.investopedia.com/options-basics-tutorial-4583012.
Tastytrade. (2021). Options Trading Education. Retrieved from https://www.tastytrade.com/tt/learn/options.
About The Author

Simpler Trading Team
Read More On Simpler Trading

Markets Rally Post-Powell’s Balanced Remarks at Jackson Hole
Track all markets on TradingView Markets Open Mixed, Pivot to Gains Post-Powell’s Address Consumers perceive a slowdown in the rapid economic upticks from recent months,

Leveling The Playing Field With A.I.
Track all markets on TradingView Leveling The Playing Field With A.I. TradeMachine has democratized big compute power, leveling the playing field for the everyday options

Navigating Market Downturns: Mastering Bear Flags and Brecher Ledges
Track all markets on TradingView Navigating Market Downturns: Mastering Bear Flags and Brecher Ledges These classic bearish patterns, essential tools for seasoned traders, offer insights


